
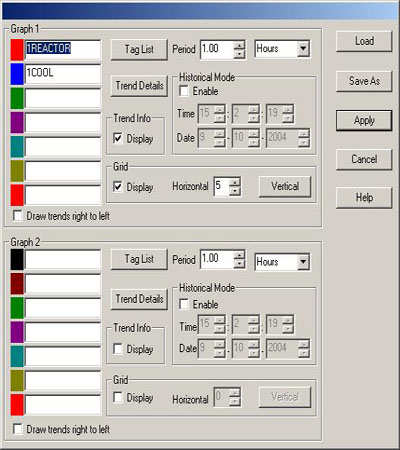
The Configure command is used to define the trending characteristics for the ONView file. Characteristics such as the ONSPEC tagged locations to be trended, their trend pen color, and the graphical mode (real-time or historical) for trending. Selecting Configure presents the following screen:
ONView Graphs
The configure screen is divided into two identical halves. The upper half defines characteristics for Graph 1 and the lower half for Graph 2.
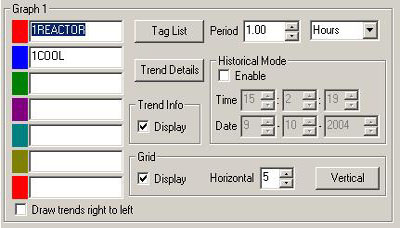
The left side of the configuration screen provides the entry fields that determine which tagged ONSPEC points will be trended.
You may have from 1 to 7 points trended for each graph.
To define a trend point, click in one of the seven entry fields (a blinking cursor will appear). Type in a valid ONSPEC tag name or use the Tag List button for easy selection.
The filename of the historical file you wish to view (e.g., EUR402M.010) may also be entered. Refer to Circular under Config Tag in Chapter 4 of the ONConfig User Guide for a description of how historical files are named.
It is also possible in this tag name entry field to redefine where ONView looks for the historical file. Place an identifying letter, followed by a colon (:) in front of the tag name or filename. Note: The identifying letter must be defined by a SET statement (See Primary Drive under Config Tag, Chapter 4 of the ONConfig User Guide).
This feature could be used to view a historical file located in an archive directory.
For example:
All historical files are written, by default, to the \Onspec\History directory. After 6 months of data collection they are copied to a network drive and deleted.
The CONFIG.SYS file has the statement with X as the network drive:
SET PHIST32=X:\ARCHIVE
Tag name TEMP1 is associated with ONSPEC table location EUR10.
To view the historical data for TEMP1 over 6 month ago, historical mode is enabled, the desired time and date for over 6 month ago would be selected, and P:TEMP1 would be entered in the tag name entry field.
Select ONSPEC Tags

Select the Tag List button and you are provided with a Tag List dialog box that displays all of the existing tags for the current ONSPEC configuration.
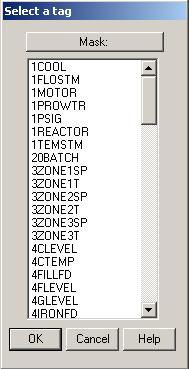
Click on a tag name in the tag list pane to highlight. Click on the OK button and the highlighted tag will be placed in the Graph entry field. Cancel will return you to the Configure window without selecting a tag.
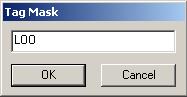
By clicking on the Mask button, you can reduce the tag list by filtering out, for example, only those tags beginning with LOO.
Select Trend Details

The Trend Details button provides the user the option of configuring certain trend details for the selected entry field. You can also initiate the Trend Details option by double clicking the mouse button within the Tag entry field.
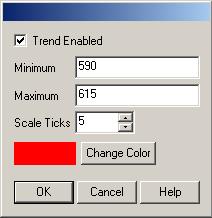
Trend Enabled
Select (Check) this option to turn the trend pen on for the selected tag name entry field. Enabling the trend will make it visible when the graph trends are plotted.
Minimum
Click in the field with the mouse and enter the desired low Y axis scale value for the trend. If left blank, the default number is determined by the MIN (Low Limit) value configured in the selected point's tag definition.
Maximum
Click in the field with the mouse and enter the desired high Y axis scale value for the trend. If left blank, the default number is determined by the MAX (High Limit) value configured in the selected point's tag definition.
Scale Ticks
Determines the number of scaling ticks shown on the Y axis.
Select Trend Colors
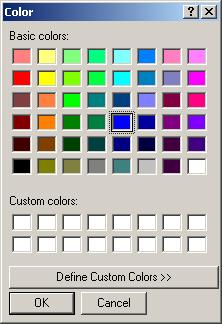
Trend Color
Select the color for the trend pen by first clicking on the Change Color button and then clicking on the desired color in the color palette. Press the OK button to complete the change.
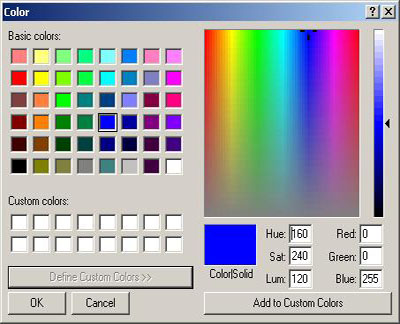
Define Custom Colors
By selecting a color and then the Define Custom Colors button, you can choose a mixture of the primary colors to create a new color. Use the mouse to point and click on a point of the color map for the new color. Click on the Add to Custom Colors button and your new color will appear in the Custom Colors box. The OK button will save the new color. Select Cancel to abort.
Select Trend Options
Select Trend Options
|
Select Trend Options |
|
|
Display |
Select (Check) this option to display the associated tag information for each point trended beneath the graph. The tag information that is shown includes: the trend pen On/Off status, the tag name of the plotted point, the tag's description, the point's current value, the tag units, and the tag's MIN and MAX Y scaling values. |
|
Grid Options |
|
|
Display |
Select (Check) this option to show grid lines on the graph. |
|
Horizontal |
This option is only available if the Display option is enabled. Use the up and down arrows to choose the number of horizontal grid lines to be displayed. |
|
Vertical |
(Reserved for future use.) |


Select Time Options
Period Field
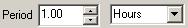
Click in the Period field and enter a number that, when paired with the selected units in Field 2, determines the X axis time scaling for the graph. In real-time mode, the X axis scaling starts from the current time and extends backwards, by the time period defined here. Use the arrow to select valid time units for the X axis scaling, (Hours, Minutes, Seconds, etc).
Real Time Mode
Real Time mode occurs when the Historical Mode is not enabled. The starting Time and Date for the graph(s) are taken from the system clock and updated in real time. The historical files used by the graphs are the most current files associated with the tag names.
For example:
Tag name PSI1 is associated with ONSPEC Location EUR13 and was configured in the tag definition as a weekly non-circular file. The current week is week 50. In real time mode, entering PSI1 as a tag name and trending would cause ONView to plot real time data, using the historical file EUR13W.050.
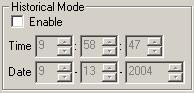
Historical Mode
Historical Mode is used to analyze past data. Real-time updates do not occur in Historical Mode. The Historical Data File that is used when in Historical Mode is determined by the Time and Date field entries.
Check on the Enable Box to enter Historical Mode.
In Real-time Mode, the current Historical file (e.g., EUR40W.034) for the ONSPEC tag name entered is trended.
In Historical Mode, the Historical mode Time and Date fields are used to automatically determine the correct Historical file to use.
For example:
Tag name PSI1 is associated with ONSPEC Location EUR13 and was configured in the Tag definition as a Weekly non-circular file. The current week is week 50. It is necessary to review the trend data for week 40. With tag name PSI1 configured as a trend point, enable historical mode and set the Date for some time within week 40. ONView automatically determines it needs to analyze historical file EUR13W.040.
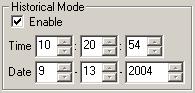
Time and Date are only available if the Enable option is checked.
Time
The three fields represent Hours, Minutes, and Seconds. Click in each field to get a blinking cursor and click on the up and down arrows to enter a time. This time will be the Starting X axis Time label. The graph will then extend backward in time according to the time period defined in the above Period fields.
Date
The three fields represent Month, Day, and Year. Click in each field to get a blinking cursor and click on the up and down arrows to enter a time. This time will be the starting date for the historical data trending. ONView uses this date to determine from which historical file to get the trending data.
For example: If trending EUR40 in historical mode with a Date of 10-10-1993, the historical file EUR40M.10 will be used for data.
Select Configure Buttons
There are five action buttons on the Configure menu.
Load
Retrieves from disk, previously configured ONView files. The file extension used is .ONV.
Save As
Saves the current file configuration to disk as a new filename. The file extension used is .ONV.
Apply
Graphs the current ONView configuration.
Cancel
Returns you to the ONView main window without saving any modifications.
Help
Starts the HTML Help program.